Description
Curriculum
Instructor
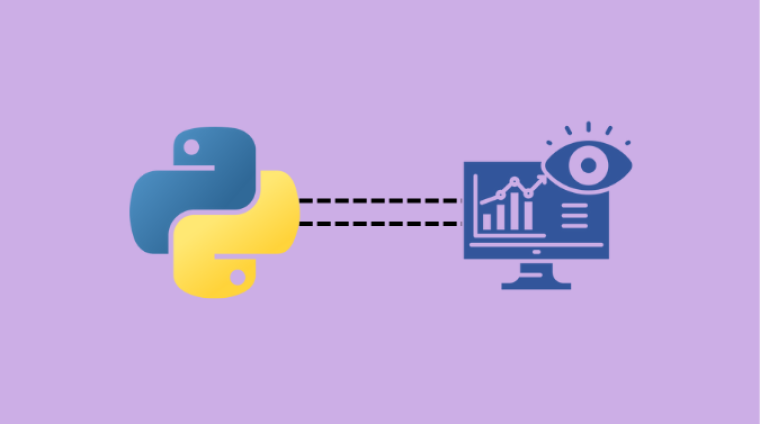
Being able to tell a story with your data is a key skill for a data scientist, and a big part of that is being able to make good visualizations.
In this course, we will look at the Seaborn and matplotlib libraries, and use them to build visuals.
We will look at how to build visualizations such as heatmaps, scatter plots, and density curves. We will also look at some real world test scores data and see how we can find insights using visualizations
Review
Free
100% positive reviews
0 student
8 lessons
Language: English
1 quiz
Assessments: Yes
Available on the app
Unlimited access forever
Skill level All levels
Courses you might be interested in
This module introduces the fundamental concepts and best practices for using REST APIs in end-to-end data pipelines. It covers the principles of RESTful architecture, including HTTP protocols and structures, and...
-
5 Lessons
Free
Explore the Data Wrangling course, focusing on techniques vital for ensuring data quality. Covering topics such as handling missing values, identifying duplicates with Pandas, and consolidating data from multiple sources,...
-
7 Lessons
Free
Machine learning is the part of a data scientist’s job that is often the most interesting, because of the unique and interesting tasks that are being done using machine learning....
-
9 Lessons
Free
Data loading, storage, and file formats encompass the processes and methods for accessing, storing, and handling data in various formats within a computing environment. This involves techniques for reading data...
-
7 Lessons
Free

